So you ran some mixed models and got some balmy messages in return? Are these those messages?
“The Hessian (or G or D) Matrix is not positive definite. Convergence has stopped.”
OR
“The Model has not Converged. Parameter Estimates from the last iteration are displayed.”
Then this post is for you. First let’s try to understand right from the basics of matrix algebra itself. Before going into the Hessian matrix let’s take a detour into the murky world of mixed models and see what’s going on there and how come we get a thing called Hessian matrix !
A linear mixed model looks like this (from Wikipedia):

where
 is a known vector of observations, with mean
 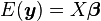 ;
;
 is an unknown vector of fixed effects;
 is an unknown vector of random effects, with mean
  and variance-covariance matrix
  ;
;
 is an unknown vector of random errors, with mean
  and variance
  ;
;
 and
and  are known design matrices relating the observations to and , respectively.
Let’s focus on the variance-covariance matrix G or some software refer to it as the D. It is the a matrix of the variances and covariances of random effects. The variances are the diagonal elements and the off-diagonal ones are covariances. So if you have a mixed model with two random effects say, a random intercept as well as the random slope, then we would have a 2 X 2 G matrix. The variances of the intercept and slope terms would be in the diagonal whereas the off-diagonal would contain the covariances.
Remember this G matrix is a one which contains variances so mathematically speaking, the matrix should be positive definite (for a matrix to be so, diagonal elements should be positive). As variances are always positive, hence this makes sense.
The Hessian matrix referred to in the warning messages you got is actually based on this G matrix which is used to calculate the standard errors of the covariance parameters. So, the algorithms which calculate them would be stuck and won’t be able to find an optimised solution if the given Hessian matrix calculated for the model doesn’t have positive diagonal elements.
So, the whatever results you may get out of the mixed model wouldn’t be correct or trustworthy. What that means is that the model which you specified couldn’t estimate parameters etc with your data. Some might choose to ignore this warning and move ahead, but my request is please don’t !!! This warning is indeed important, and NO the software doesn’t have a vendetta against you/your project.
The next step is obviously to ask what can you do in this circumstance and what might be the solution. One method might be to check the scaling of your predictor variables in the model. If they are highly different then that can be a good reason why the software has trouble in variance calculation. So, just a change in scaling of the predictors can solve your problem here.
Another method is when some covariance estimates are 0 or have no estimates at all or don’t produce the standard errors at all (SPSS usually does this, and produces blank estimates). Now don’t go on ignoring this variable, as something is fishy with the model itself. For if the best estimate of your variance is zero, this means there is zero variance within your data for the effect under consideration. For example, you have introduced a random slope for that effect, but in actuality the slopes do not differ across the subjects of your study in that effect and possibly a random intercept component might well explain all the variation.
So just remember when something like this happens, the best possible solution for you to do is to respecify the random components in your model and that could be about removing a random effect. Sometimes you might feel or have been told that a given random effect has to be introduced because of the design of the study, you wouldn’t find any variation in the data. Another thing, is that you could specify perhaps a simpler covariance structure which contains lesser number of unique parameters to be estimated.
Let me give an example to highlight this situation:
A researcher wants to understand the behavioural responses of rats living in their cages in a lab building by doing standard behavioural tests. Since the cages are situated in different floors, in different corners in the lab building, the researcher wanted to see if before experimentation is there any change in their responses to simple behavioural tests. Now let’s suppose there are 1000 rats in each floor and there are 10 floors in the building. That makes it 10000 rats which would be a huge number to study all of them individually. So, we take samples of rats within each floor and the design indicates including a random intercept component for each floor, to account for the fact that rats in the same floor may be more similar to each other than would be the case in a simple random sample. So, if this is true, we would likely want to estimate the variance of behavioural responses among floors.
But we know that modern animal facility guidelines calls for rigorous protocols to be followed and because of that rats are kept in similar cages with as similar conditions as possible. Then we can easily see here that there wouldn’t be much variance in the behavioural responses among the floors. This leads to the scenario i put up before, i.e., variance for floors = 0 and the model would be unable to uniquely estimate any variation from floor to floor, above and beyond the residual variance from one sampled rat to another.
Finally, another option is to use a population averaged model instead of a linear mixed model. As population averaged models don’t have any random effects, but do contain the correlation of multiple responses by the sampled individuals.
For more, read these —
- West, B. T., Welch, K. B., & Galecki, A. T. (2007). Linear mixed models: A practical guide using statistical software. New York: Chapman & Hall/CRC
- Linear mixed models in R- http://www.r-bloggers.com/linear-mixed-models-in-r/
- Model Selection in Linear Mixed Models- http://arxiv.org/pdf/1306.2427v1.pdf
- Hessian matrix in statistics- http://www.slideshare.net/FerrisJumah/hessin
